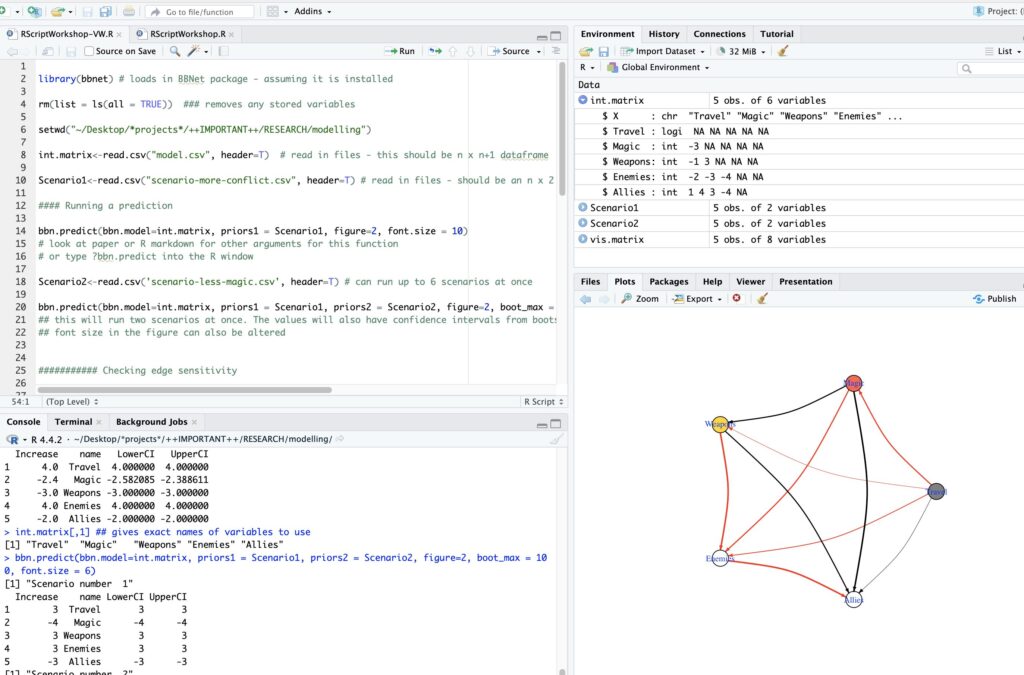
This is a short update on a workshop I attended, where I decided to map out game and magic systems against existing systems using R. Note I am a newbie in R, though I have worked a bit in Python some time ago and some of this knowledge was helpful and trying to understand a bit on how to read columns and rows.
This is what I have done:
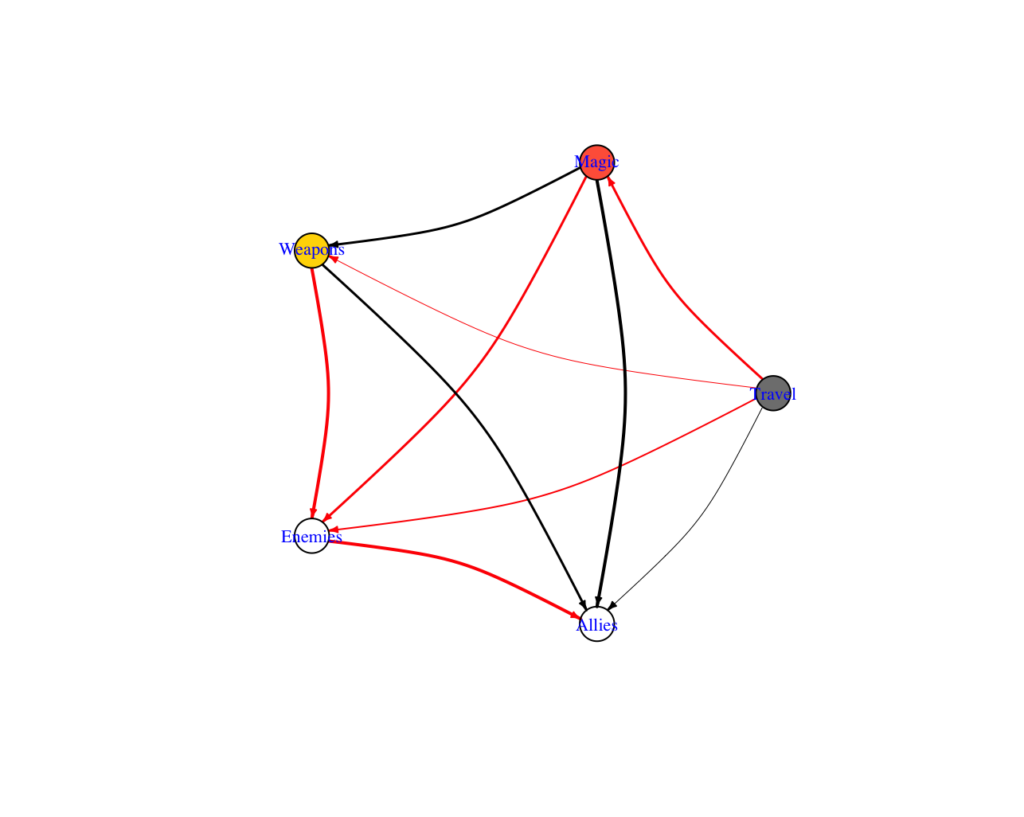
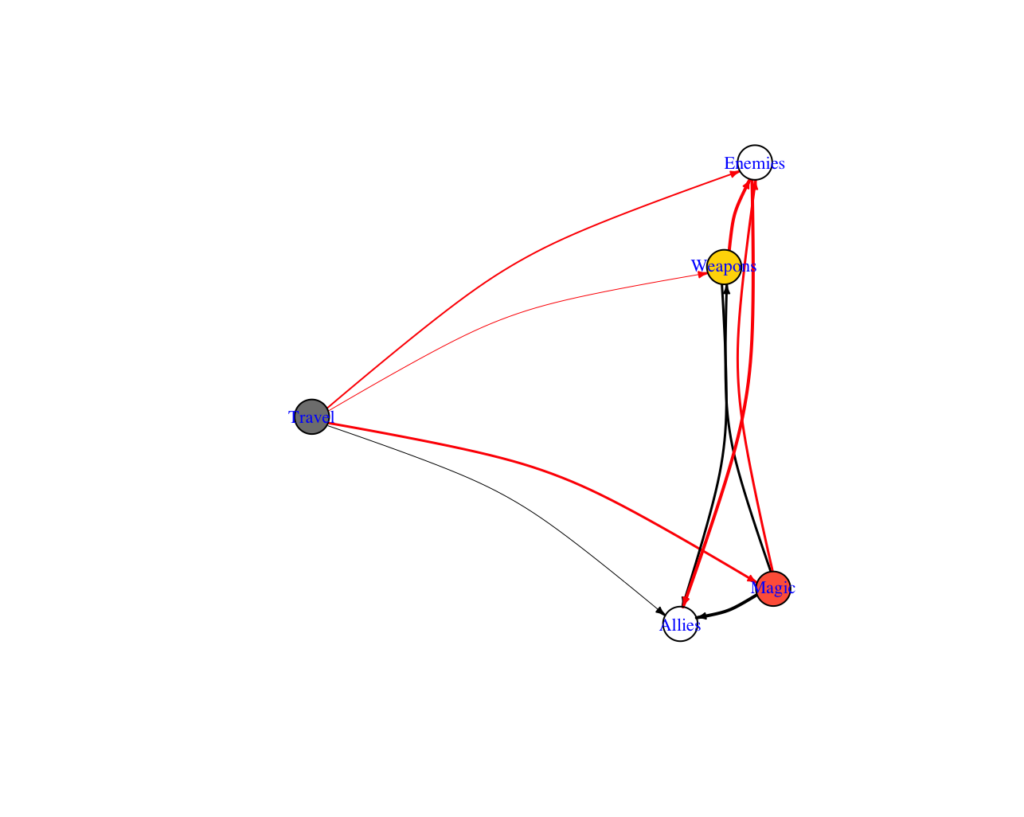
- Mapped a very simple system that uses magic (from my current project in RPG and DnD), and other aspects from observations and common structures, such as enemies, allies, weapons, etc.
- I have added travel to this as part of the project is looking at ‘mobility’
- I have looked at relationships between these nodes; e.g., more allies, fewer enemies, I suppose. And added these to a table.
- I have created a few scenarios to test: one that there is the scarcity of magic, another with less travel and another with lots of conflict (particularly between allies).
- I have looked at how the model changed according to each scenario
- I have recreated the table where I mapped the network and generated different visualisations.
Lessons learnt so far and next steps:
I would like to map these out against existing systems and see differences. My next step is to see how these can change or overlap.
Keep you posted :) Some plots are below!
Project link: https://www.southampton.ac.uk/research/projects/civic-imagination-practices-civicmagic-towards-a-methodology-to-facilitate


